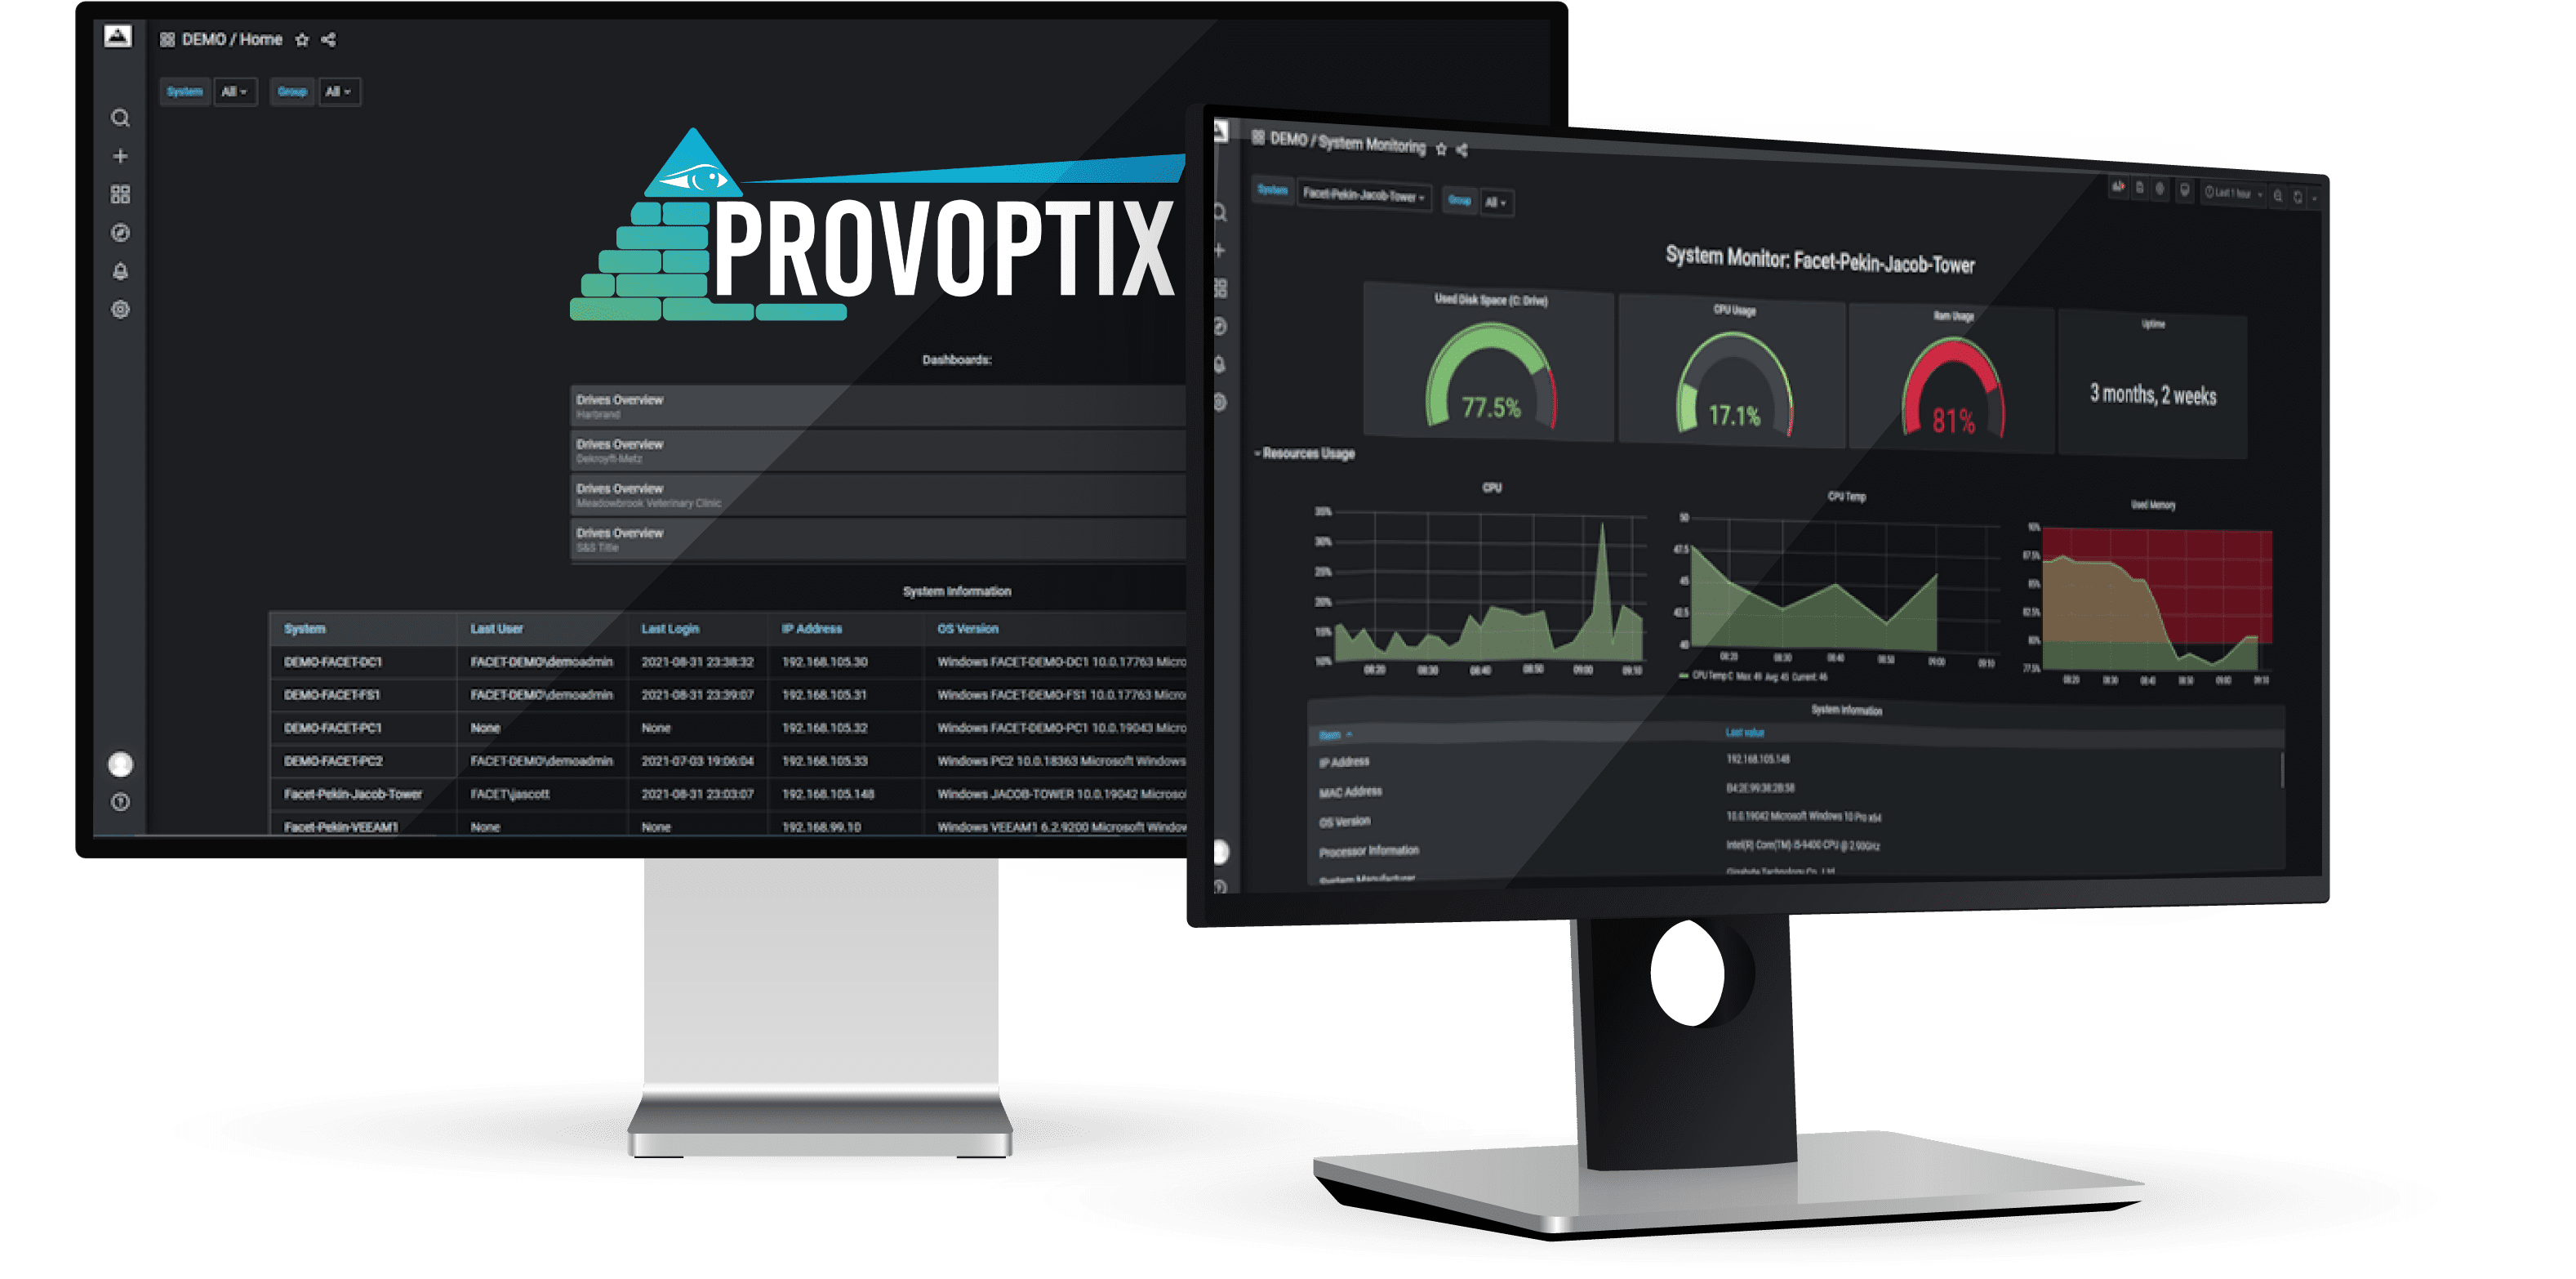
Designed to Increase Customer Uptime
Beat Alert Fatigue
Relevant data delivered on demand helps your team cut through the noise to actionable notifications.
Endpoint to Cloud Monitoring
Manage every level of your customers’ networks with ease, from on-site hardware to cloud solutions.

Eyes on the Ground
Our proprietary hardware solution monitors conditions on-site to identify bottlenecks and issues before disruptions occur.

Value Added for Clients
With Provoptix’s client dashboard, customers can see their network health in real time. Our customers love Provoptix—we think yours will, too.
24/7/365 Monitoring and Management for IT Companies
Tired of constant meaningless alerts from monitoring softwares? Tired of RMMs that promise single-pane solutions and don’t deliver? Provoptix is the IT monitoring solution that offers secure 24/7 monitoring that does the legwork for your team. Clear, concise dashboards and on-demand graphing from a bird’s eye-view down to any single endpoint give you a clear window into every network you monitor.
Proactive monitoring dashboard for all customer alerts
Specialized solutions, add-ons and apps for common products
Drive storage and health monitoring for all endpoints
Alert monitoring for on-call and after-hours emergencies
Provoptix Dashboards Simplify IT Management
Get metrics and data immediately for each customer with Provoptix Dashboards. Monitor drive usage, bandwidth usage, printers, and more by navigating the dashboard. Customers can be granted access to their data and dashboard if you choose.

Login Page
Welcome to Provoptix! This is what you will see when you navigate to Provoptix. Should you choose to grant them access, this is also what your clients will see when they log into their dashboard. They will log in using their email address and password. MFA can be enabled for added security.
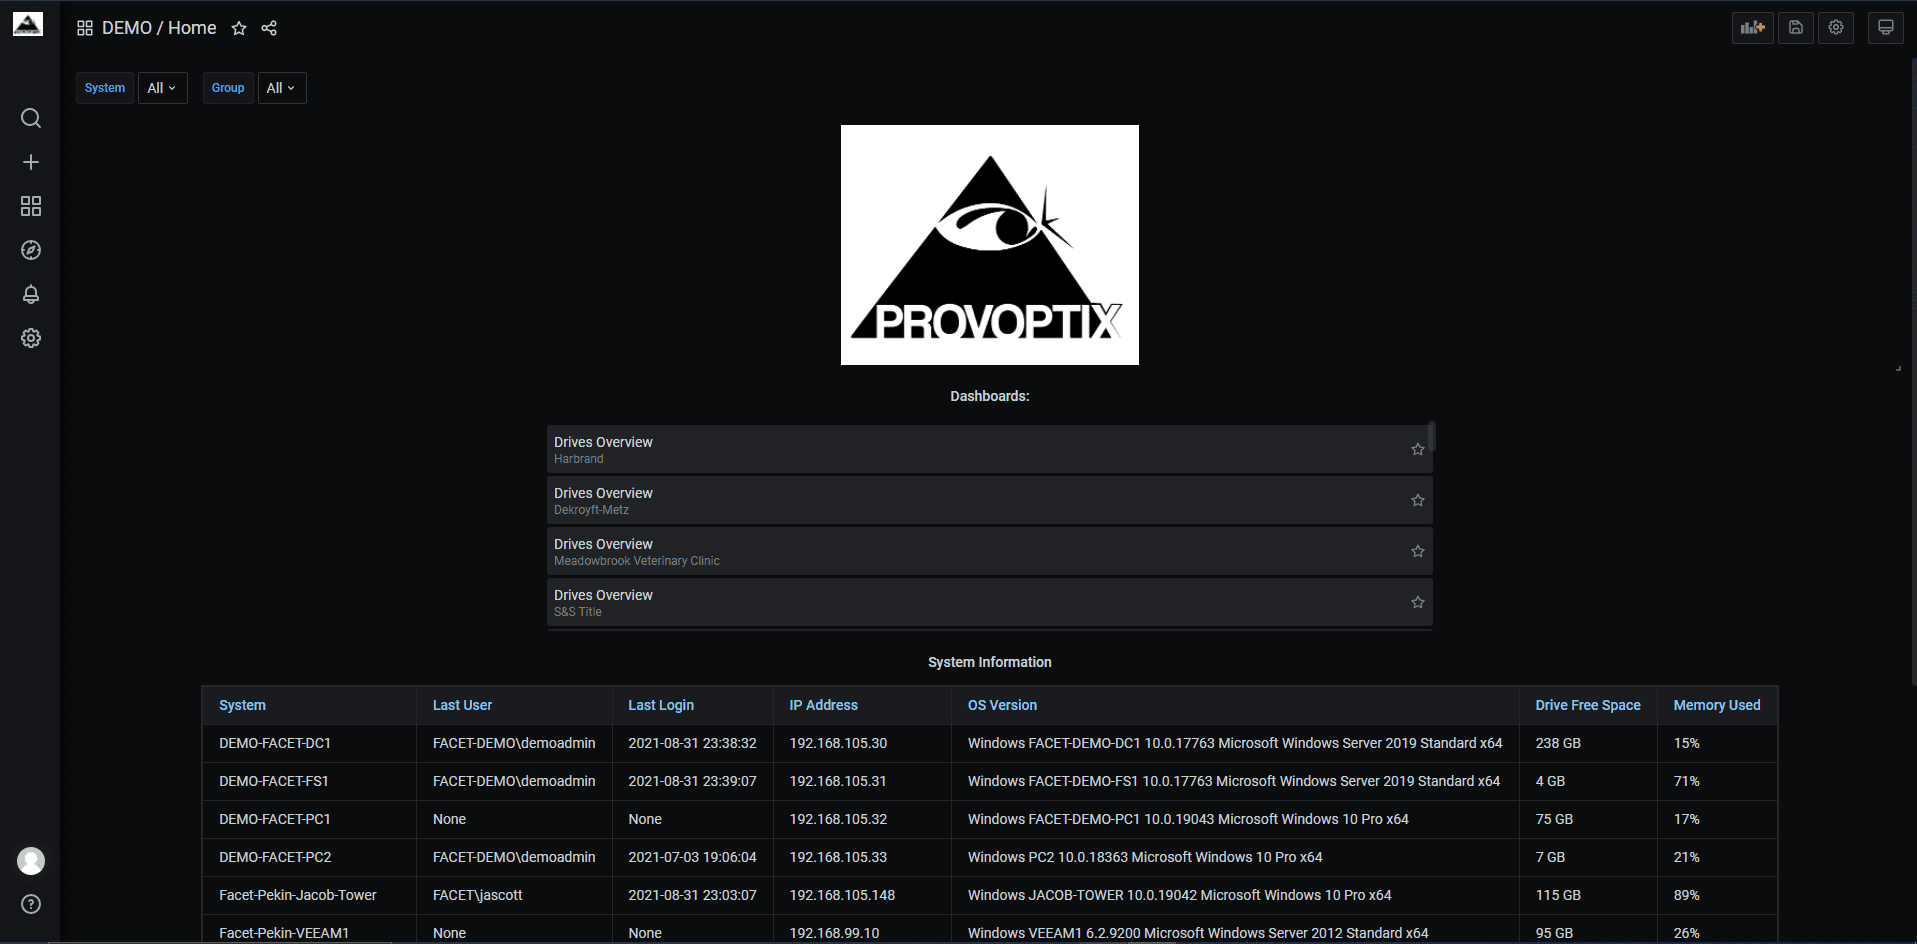
Home Page
This is what every user will first see when logging in. All dashboards to which the user has access will be listed here. Below the list of dashboards is the system information table. This table contains some information about servers and computers monitored for this client such as the system name, the last user who was logged in, IP address, as well as other relevant information.
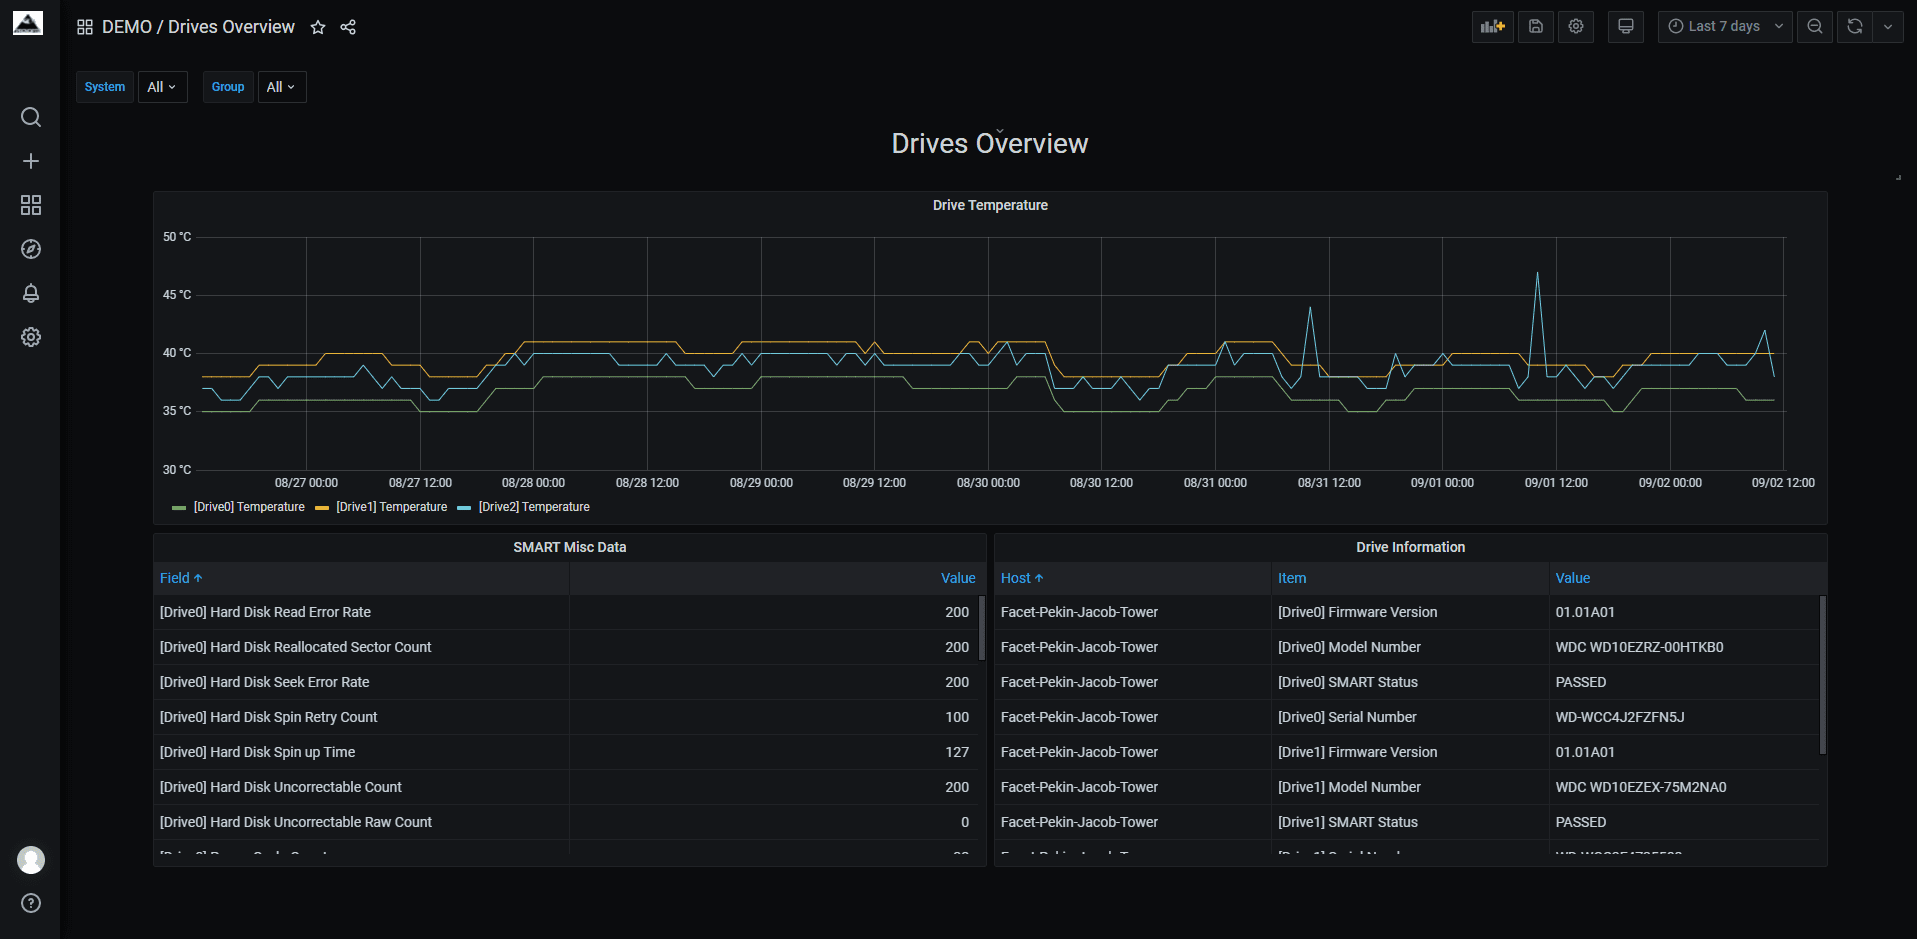
Drives Overview
This is the drives overview dashboard. The graph shows the temperature of all drives that are monitored. Some of the data included: number of hours powered on, number of errors when seeking for data, model numbers, and drive failure status. With this page, signs of hard drive failure can be caught before the drive fails completely. Alerts about drive status are also shown on the proactive monitoring dashboard.
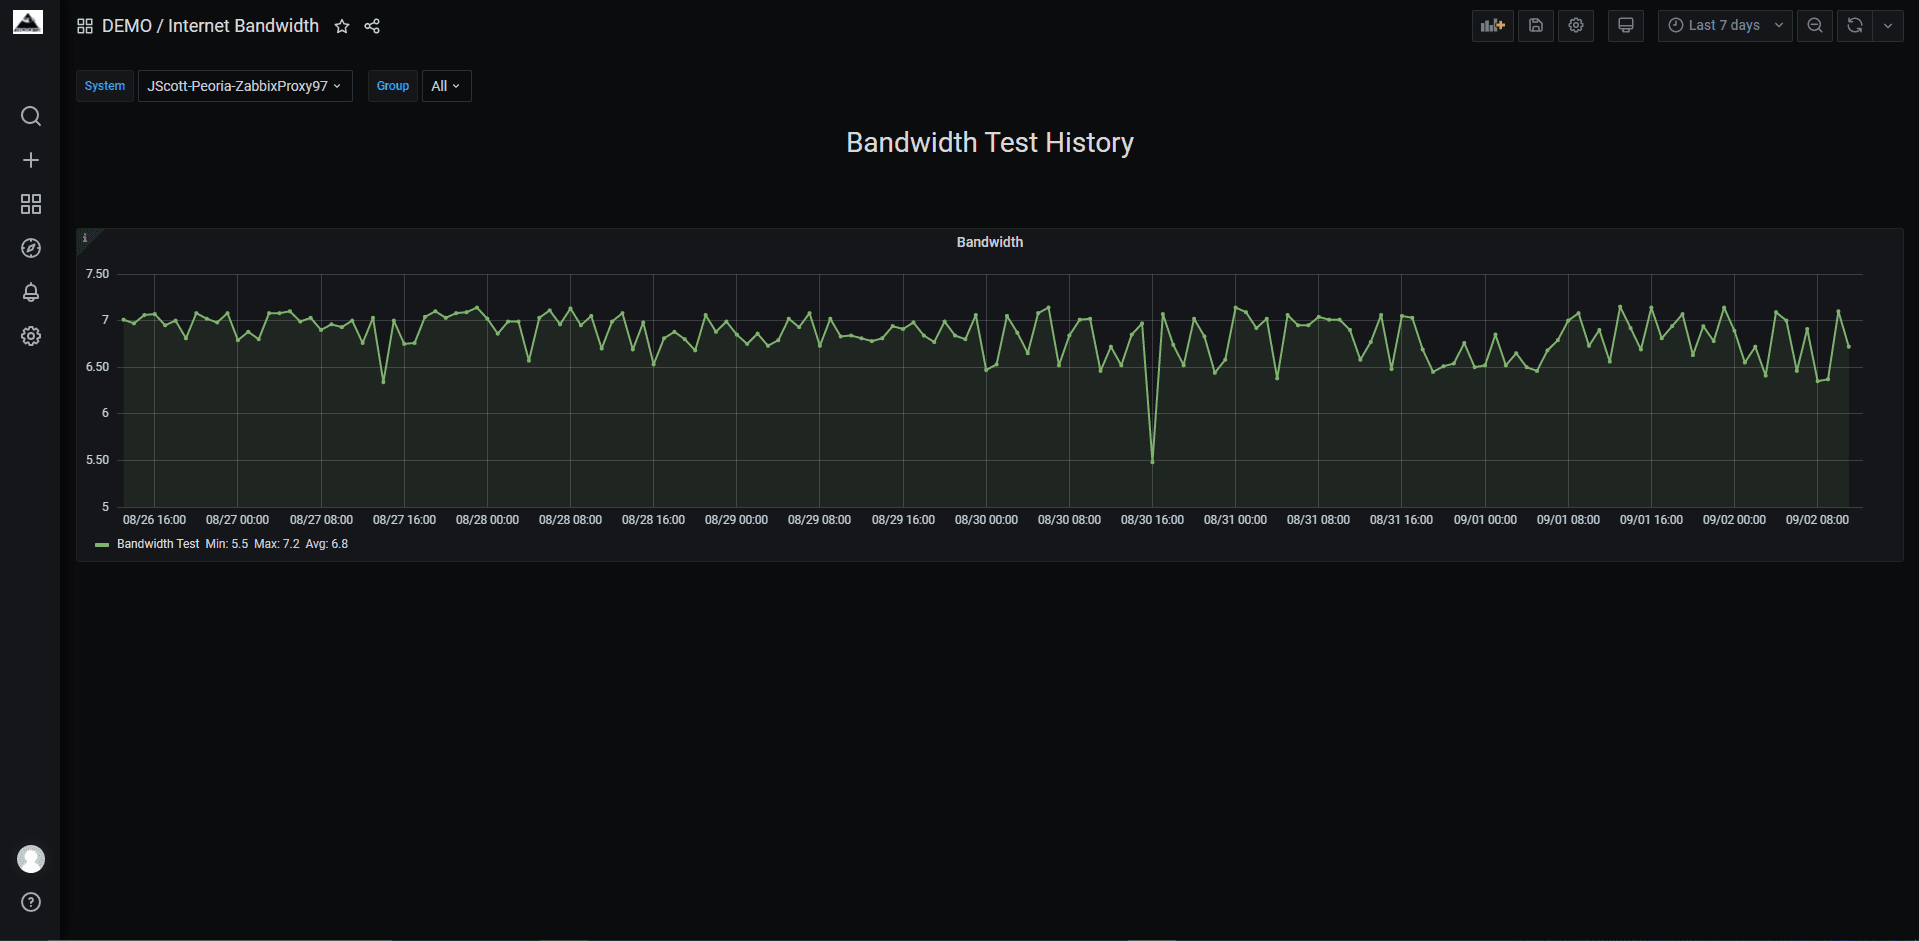
Bandwidth Test History
The graph here shows the bandwidth history of the network. This can be used to detect when a network is slower than the ISP claims.
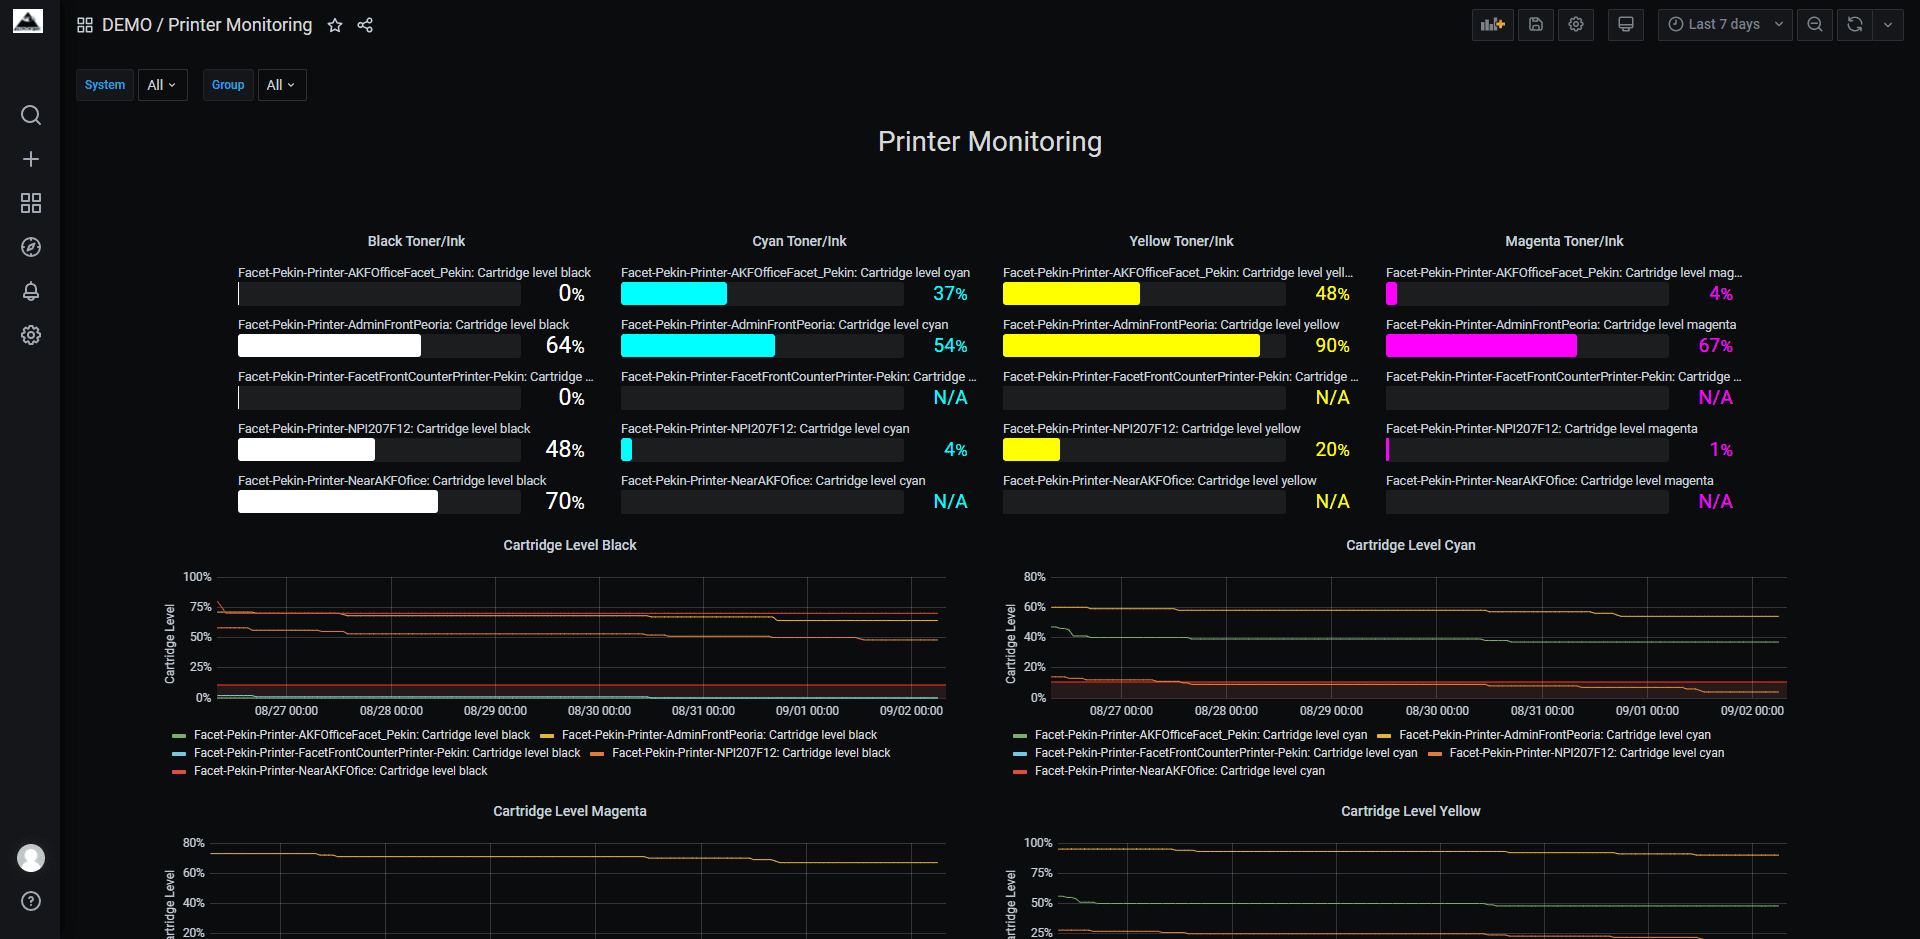
Printer Monitoring
Printer dashboards help identify ink usage trends and other helpful metrics. The top bar graphs show current ink/toner levels in all discovered printers on a network. The line graphs show the trend in ink/toner usage over time. A second printer dashboard shows the current total number of pages printed by each printer and pages printed over time. An additional table provides information about each printer such as model, manufacturer, IP address, serial number, and cartridge model numbers.
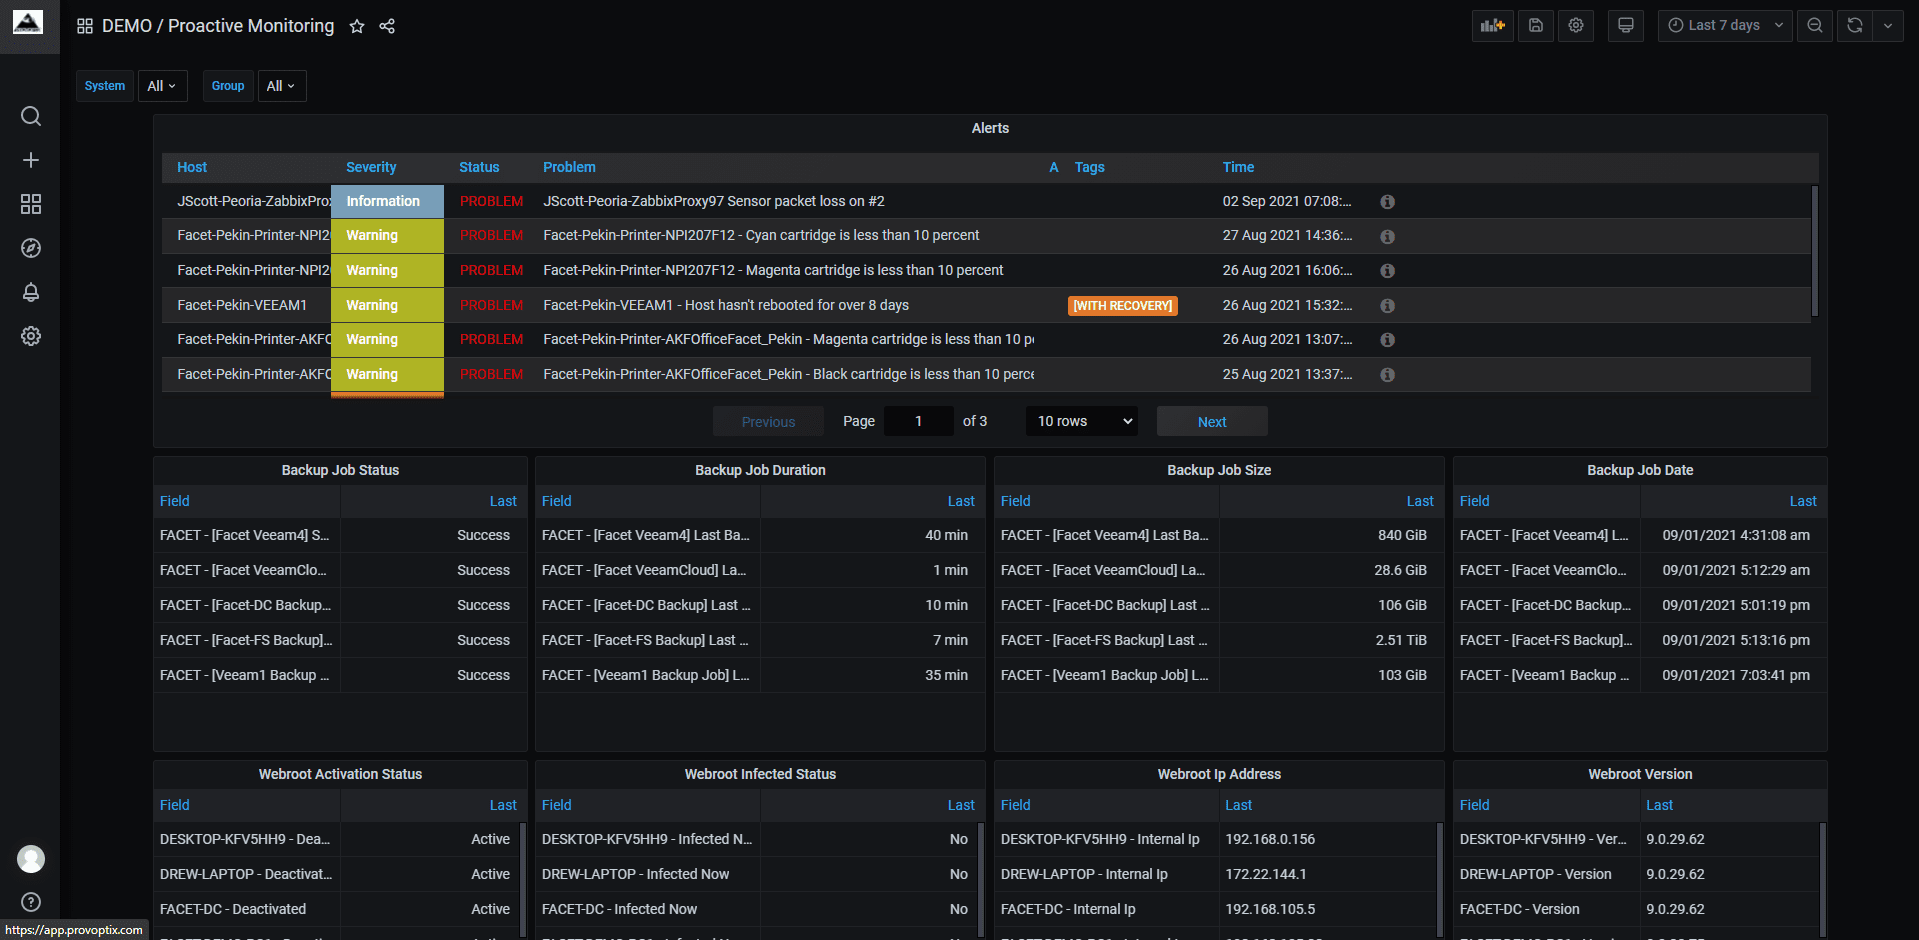
Proactive Monitoring
This is the proactive monitoring dashboard. This serves as an all-in-one place to see the most important data about clients. The top table shows any alerts about problems that have occurred with any monitored devices. Below the alerts table is Veeam backup monitoring. This allows the user to see the status of all Veeam backup jobs, as well as the size of the job, the time it took to run, and the last time the backup ran. Failed jobs will show in the status table, as well as in the alerts table. Next is the antivirus status tables. With these tables we can see information for each machine running the AV like activation status, threat detection, and version. Other general information is shown like machine name, current logged in user, and IP address.
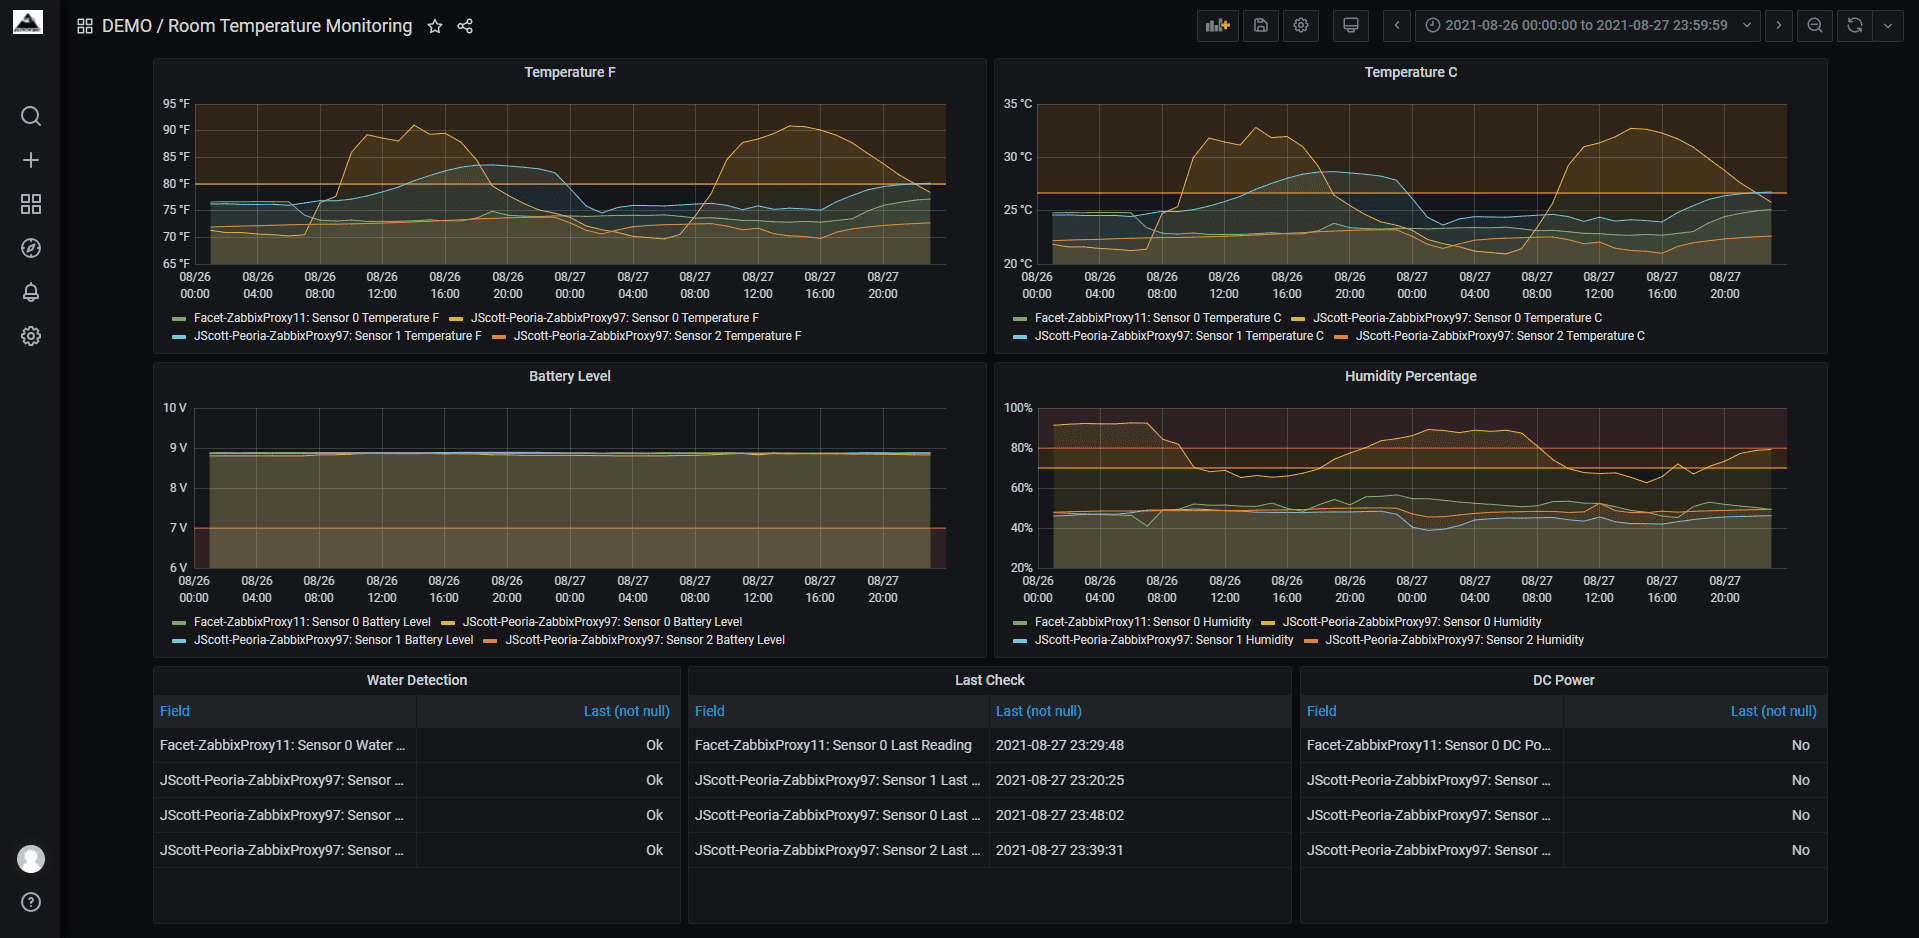
Room Temperature Monitoring
This dashboard summarizes data collected by the Facet temperature monitor. The temperature trend can be seen in Fahrenheit on the left and Celsius on the right. Below the temperature graphs is a graph of the battery level of the monitoring device. A graph of relative humidity can be seen to the right of the battery level graph. Below the graphs we have information such as if water was detected near the monitoring device, the last time the device checked the temperature and humidity, and if the device is on battery or plugged into the wall.
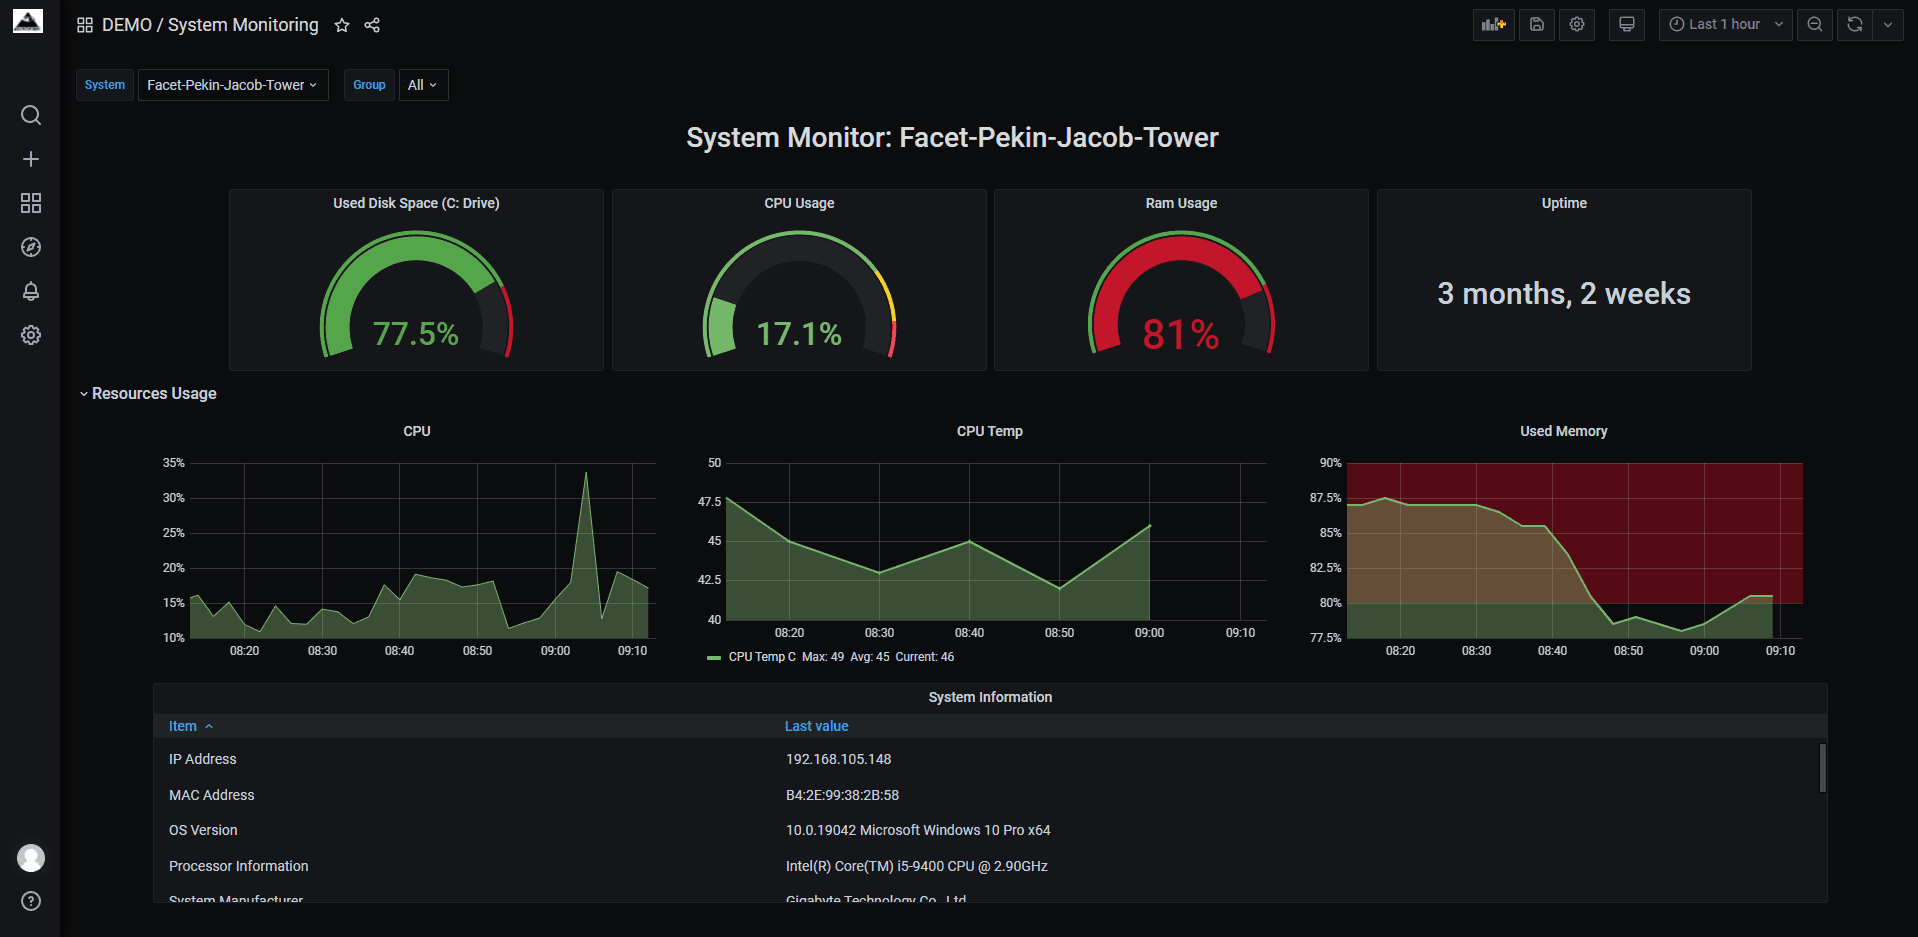
System Monitoring
This is the system monitoring dashboard. It is designed for look at a lot of data about a single system. The graph data that can be seen on this dashboard is used disk space, CPU usage, memory usage, and system uptime. Below the graphs and gauges is a table with additional information about the computer such as IP address, MAC address, OS Version, processor model, system manufacturer, system model, and basic information about the hard drives connected to the computer. This dashboard can be used as a starting point when a customer calls about an issue. A technician can look at the history of the machine to determine what could have gone wrong.
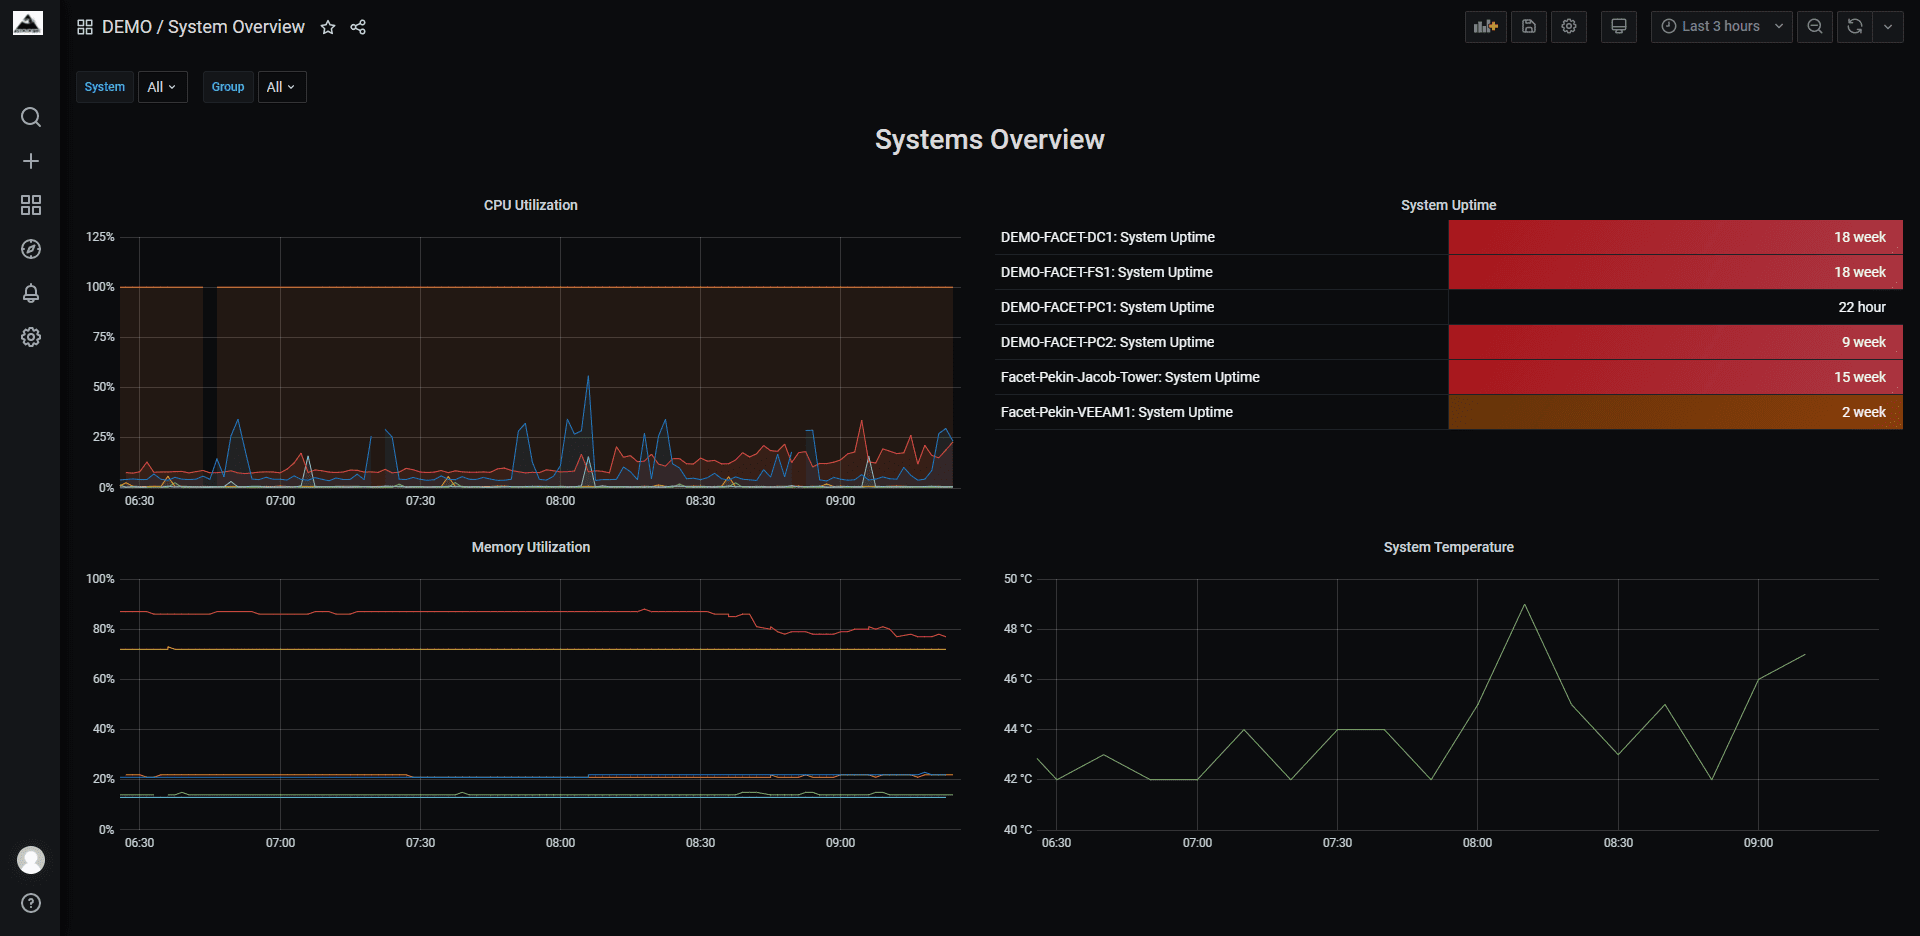
System Overview
This dashboard provides a view of all the machines on a network at any given time. The graphs show data such as CPU usage, memory usage, and system temperature. Also shown is a table of system uptimes. This dashboard can be used to find systems that may be overworked and at what time they are overworked.
Secure IT Monitoring and RMM Features

Built for Security
With Provoptix, no inbound firewall ports are left exposed to the internet, and all data is sent directly to the centralized Provoptix server with no possible connections from the server to endpoints or monitoring proxies. Provoptix offers greater security than other cloud-based monitoring software.

Built for Integrations
Provoptix integrates with popular IT solutions and products to work for your IT consulting company. Our team is constantly adding new integrative features for seamless management, monitoring, and maintenance.

Built for Growth
With Provoptix, onboarding customers is easier and faster. Our team designed Provoptix to accommodate fast-growing MSPs with features that grow with you. Provoptix works just as well for large IT companies as it does for small operations and scales with your business.

Built for MSPs
By an MSP, for MSPs, Provoptix is the only IT monitoring solution that addresses the needs of modern MSPs. If your old monitoring solution isn’t cutting it, try Provoptix risk-free for 30 days and see your customer satisfaction improve.
Unlock Early Access to Provoptix
Contact us to request your free 30-day demo of the Provoptix Monitoring Suite.

